The RSI indicator (Relative Strength Index) is one of the most popular momentum indicators in Forex trading, helping traders identify overbought and oversold market conditions. By measuring the speed and magnitude of recent price movements, RSI provides clear signals for potential reversals or trend continuation. When applied on Exness platforms with fast execution and transparent pricing, RSI becomes a practical and reliable tool for traders at all experience levels.
Understanding the RSI Indicator in Forex
The Relative Strength Index was developed by J. Welles Wilder and is classified as a momentum oscillator. It fluctuates between 0 and 100 and reflects whether an asset is being bought or sold too aggressively.
RSI is widely used across global markets because it is simple to read, adaptable to different timeframes, and effective in both trending and ranging conditions.
How RSI Is Calculated
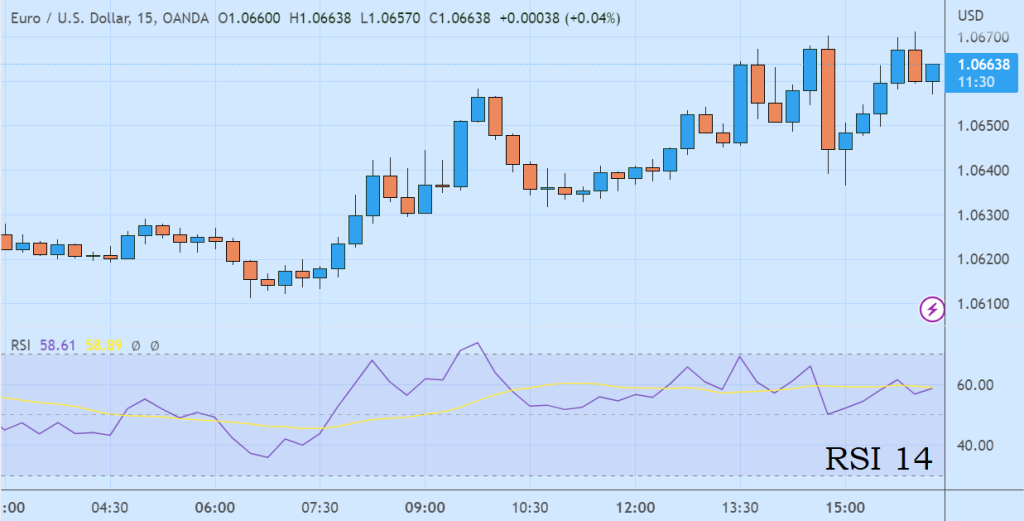
RSI compares average gains and losses over a specific period, most commonly 14 periods. The formula converts this comparison into a value between 0 and 100.
While traders do not need to calculate RSI manually, understanding its logic helps interpret signals more accurately, especially during volatile sessions.
Overbought and Oversold Levels Explained
The most common use of RSI is identifying overbought and oversold zones. These zones signal potential exhaustion of the current price move.
However, they should be interpreted carefully within the broader market context.
What Does Overbought Mean?
An RSI reading above 70 typically indicates an overbought condition. This suggests that price has risen too quickly and may be due for a pullback or correction.
On Exness (エクスネス), where spreads remain stable even during active sessions, traders can monitor RSI signals efficiently without worrying about distorted pricing.
What Does Oversold Mean?
An RSI reading below 30 signals an oversold condition. This implies that selling pressure may be weakening and a bullish reversal could occur.
Oversold conditions are particularly useful for identifying potential buy opportunities near key support levels.
Using RSI in Trending Markets
One common mistake is assuming that overbought or oversold automatically means reversal. In strong trends, RSI can remain extreme for extended periods.
Understanding trend context is essential for effective RSI trading.
RSI Behavior in Strong Trends
In strong uptrends, RSI often stays between 40 and 80 rather than dropping below 30. In downtrends, RSI may remain between 20 and 60.
Adjusting expectations helps traders avoid premature entries against the dominant trend.
Combining RSI with Trend Direction
Using moving averages or market structure alongside RSI improves signal accuracy. For example, in an uptrend, traders may focus on RSI pullbacks toward 40–50 instead of waiting for oversold conditions.
Exness provides smooth chart performance on MT4 and MT5, making multi-indicator analysis efficient even on lower timeframes.
RSI Divergence: A Powerful Reversal Signal
RSI divergence occurs when price and RSI move in opposite directions. This often signals weakening momentum and a potential trend reversal.
Divergence is considered one of the most advanced and reliable RSI-based strategies.
Bullish and Bearish Divergence
Bullish divergence forms when price makes lower lows while RSI makes higher lows, suggesting selling pressure is fading.
Bearish divergence appears when price makes higher highs but RSI forms lower highs, indicating weakening buying momentum.
These setups are most effective near support and resistance zones or after extended price moves.
Best RSI Settings for Forex Traders
The default RSI setting of 14 periods works well for most traders. However, adjustments can be made depending on trading style.
Scalpers may use shorter periods for faster signals, while swing traders may prefer longer settings for smoother readings.
RSI Settings by Trading Style
Short-term traders often use RSI 7 or 9 for quicker reactions. Swing and position traders may use RSI 21 to filter noise and focus on broader momentum shifts.
Exness account types such as Standard, Raw Spread, or Zero allow traders to apply RSI strategies flexibly across different cost structures.
Risk Management When Trading with RSI
RSI should always be combined with proper risk management. Indicators do not guarantee outcomes, especially during high-impact news events.
Stop Loss and position sizing remain critical for long-term consistency.
Managing Trades Around RSI Signals
Always wait for confirmation, such as candlestick patterns or structure breaks, before entering a trade. Avoid entering solely because RSI reaches extreme levels.
Exness offers instant execution and negative balance protection, helping traders manage risk more effectively during volatile market conditions.
Why RSI Works Well on Exness Platforms
RSI strategies rely heavily on accurate price data and responsive platforms.
Exness stands out with transparent pricing, fast order execution, and strong regulation under FCA and CySEC. Being trusted in demanding markets such as Japan further reinforces the broker’s reliability for technical traders using indicators like RSI.
Traders with smaller capital can also apply RSI strategies using Exness Cent accounts combined with flexible leverage options.
Practice RSI Trading the Smart Way
Like all technical tools, RSI requires practice to master.
Testing different RSI strategies in live market conditions without financial risk allows traders to understand false signals and improve timing.
Practice this strategy now on a Demo Exness account – risk-free – before applying it to real trades.
Conclusion
The RSI indicator is a powerful and versatile tool for identifying overbought and oversold conditions in Forex trading. When combined with trend analysis, divergence, and disciplined risk management, RSI can significantly improve trading decisions. With Exness providing stable platforms, fast execution, and flexible account options, traders worldwide can confidently use RSI to navigate both trending and volatile market environments.